


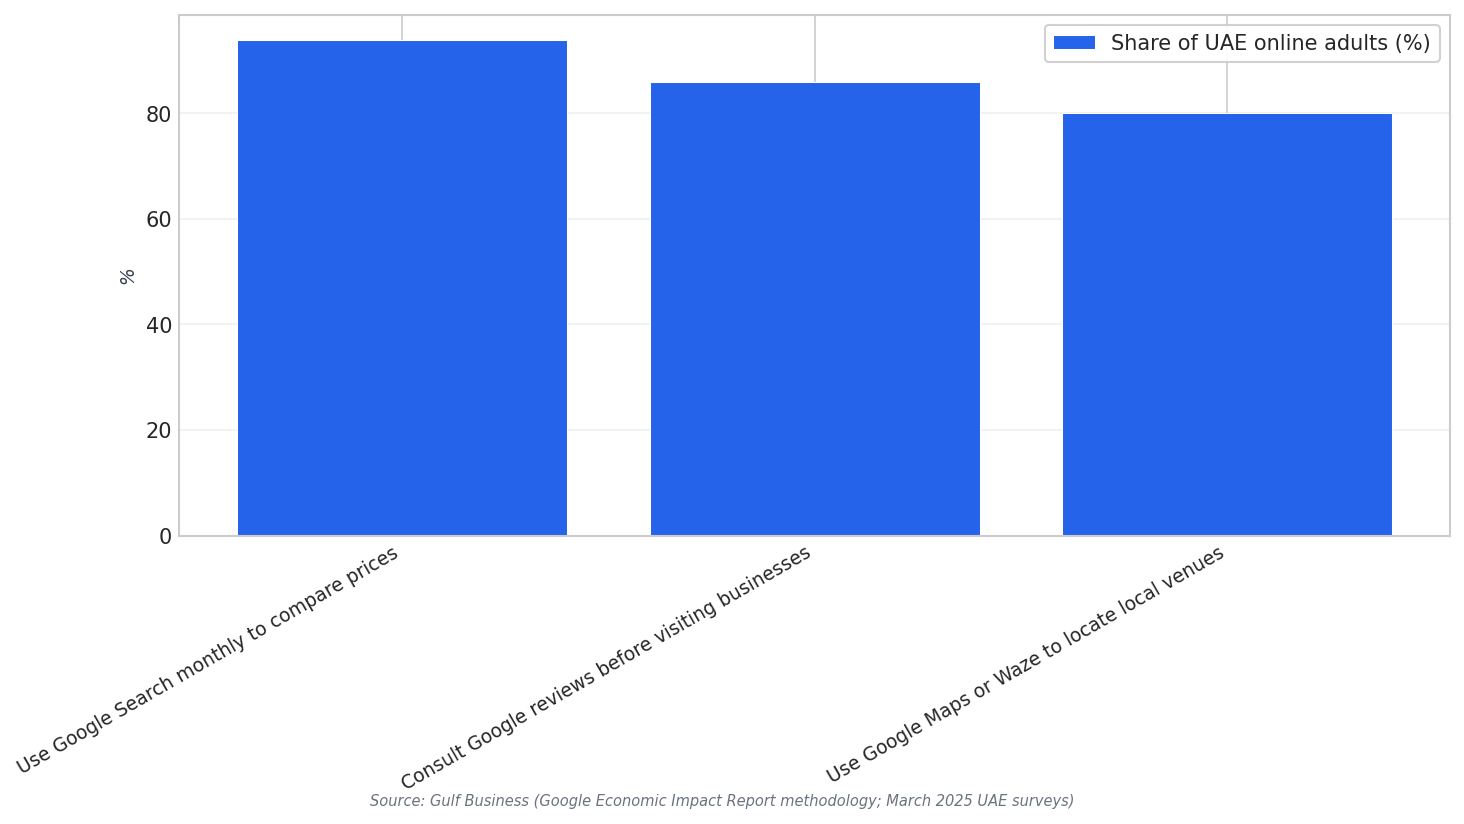
Designing a customer satisfaction survey UAE plan starts with local customer behavior. In March 2025 surveys of UAE-based online adults found high digital usage that shapes how customers discover, evaluate, and decide. The same source notes 94% use Google Search monthly to compare prices, 86% consult Google reviews before visiting businesses, and 80% use Google Maps or Waze to locate local venues. These signals matter because they suggest satisfaction is influenced both by the core service and by the “before the visit” journey, including pricing clarity, review confidence, and location convenience.
Method comes next. A reliable approach is to combine short post-interaction surveys with always-on feedback from the channels customers already use. The UAE survey methodology cited in the source is a helpful reference point for execution discipline: it was conducted in March 2025 with 1,110 UAE-based online adults and 389 business leaders, carried out in English and Arabic, and results were weighted to ensure national representation. Even if your company sample is smaller, you can still apply the same principles: bilingual collection, consistent timing, and weighting or segmentation so results are not distorted by one dominant customer group.
To turn survey answers into management signals, define KPIs that mirror the full experience. Net Promoter Score (NPS) is one KPI explicitly referenced in the sources, where an e& UAE relationship-manager initiative is reported to have “improved NPS” and “reduced churn.” Complement NPS with journey KPIs that connect to UAE digital habits: survey items about price-comparison ease (linked to the 94% Search behavior), review trust (linked to the 86% who consult reviews), and findability (linked to the 80% using Maps/Waze). Keep questions short and specific so you can tie results to fixes in content, listings, and frontline operations.
Local Benchmarks You Can Use Without Guesswork
Benchmarks do not need to be industry-wide scorecards to be useful. You can benchmark against concrete operational outcomes reported in UAE contexts. For example, e& UAE described an eRM pilot that expanded by 425%, alongside improved NPS and reduced churn, and also reported that its Dashboard 360 experience drove a 57% increase in engaged sessions and a 51% rise in session growth while reducing reliance on support teams. These figures are not universal “targets,” but they are practical benchmark patterns: satisfaction improvements often show up in adoption, engagement, and reduced support dependency.
Industry conditions also shape what “good” feels like for customers, so your survey should capture context. In Dubai hospitality, one UAE-focused report noted hotel average daily rates at AED 775 and citywide occupancy at 80.7% at the start of the year (Q1 2026 context). Another travel industry report later described UAE hotels having “occupancy in the 20s vs 80s last year” for Q2, highlighting how quickly experience pressure can rise when demand drops. In practice, that means adding questions on responsiveness, flexibility, and issue resolution, not just overall satisfaction.
What is the best customer satisfaction survey UAE method for bilingual audiences?
Which KPIs should I track alongside satisfaction survey scores?
What local benchmark signals can I use if I do not have industry averages?
How do online reviews and maps affect customer satisfaction in the UAE?